Beat the Odds
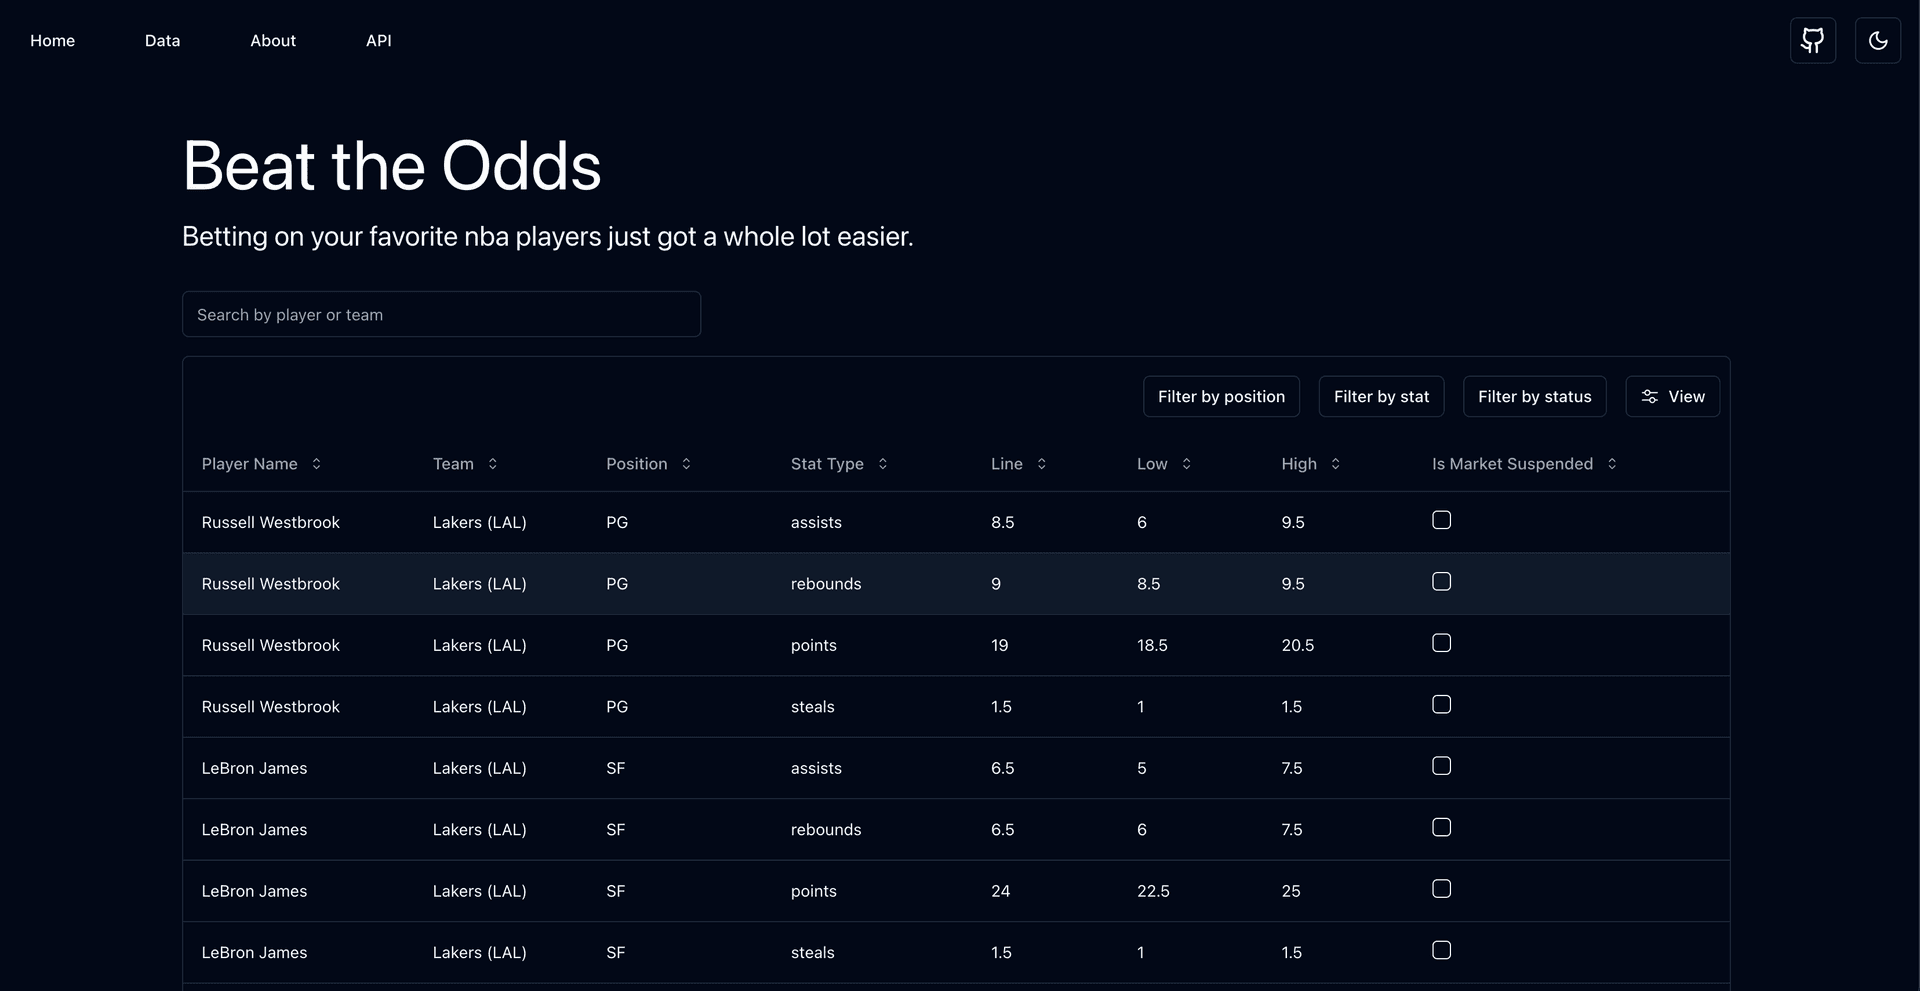
A web app that was created specifically to help the average basketball fan quickly and effectively visualize and organize complex market data for their favorite nba players and teams.
Project Details
Technologies Used
TypeScript, React.js, shadcn/ui, TanStack Table, Next.js, Vitest, Tailwind
Project Features
- Visualize player market data represented as a table. Each row of the table represents a market. For each market, included is the low and high lines for that market from the alternates dataset. For example, for Westbrook’s points, there are columns for his low (18.5) and high (20.5).
- Filter data by position, stat type, and or market status (suspended or not).
- An indication of whether a market is suspended or not.
- Manually suspend or release.
Project Overview
A web app that takes complex, technical market data (in json format) for nba players and transforms that data in a way so that the average basketball fan can visualize and understand.