D3 Data Journalism
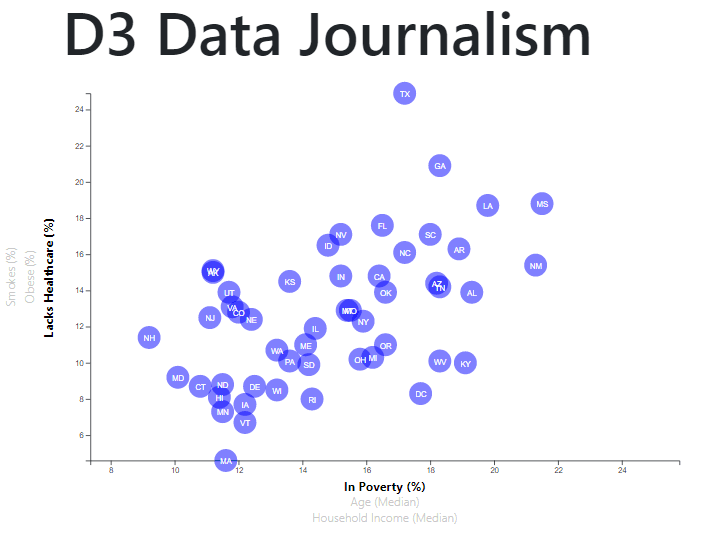
A visualization built using D3 intended to show various health risks facing particular demographics across different states in the U.S. (for example, access to healthcare vs median household income).
Project Details
Technologies Used
D3.js, React
Project Features
- Each circle on the visualization represents a different state in the U.S.
- To see the actual values for a particular state, you can hover over the circle for that state to see a tooltip, which contains the actual data values based on the currently selected x and y axis labels.
- The dataset used for this project is based on 2014 ACS 1-year estimates. It includes data on rates of income, obesity, poverty, etc. by state. The information comes from the U.S. Census Bureau and the Behavioral Risk Factor Surveillance System.
Project Overview
The visualization is intended to show various health risks facing particular demographics across different states in the U.S. (for example, access to healthcare vs median household income). To compare different factors or data variables, you can click on the x and/or y labels to change the view of the visualization.